FORMULA® R Test system software
FORMULA® R Test system software
FR software automates all phases of the measurement process, from test routine development and debugging to measurements and service procedures.
The software is uniquely simple to use, consisting of an intuitively understandable high-level symbolic graphical environment represented in table form Fig. 2. This means that the test program developer does not need to be qualified as a programmer.
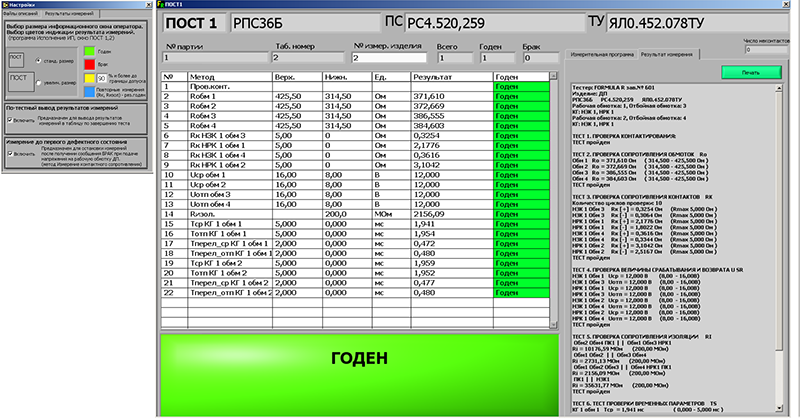
Fig. 2 Operator mode interface
Test methods library
The basis for automating ATE operations is the Library of Low-Current Relays Measurement Methods, created in compliance with metrological requirements and built into the FR software.
The Library of Low-Current Relays Measurement Methods includes all the electrical test methods, significantly simplifying the development, updating and modification of test programs and reducing processing time and quantity of errors created, as well as error correction.
Using the Library of Low-Current Relays Measurement Methods, the measurement program is created by simply moving data from the technical specification or datasheet for the item tested to the «Measurement Program Editor» table Fig. 3.
It takes a maximum of 10 minutes to write one test program: just select the necessary measurement methods from the Library, and enter the test conditions and anticipated results.
All tests and the parameters indicated within them are automatically combined into one measurement program, which can be run immediately on the DUT, either in full or step by step.
The convenience of the FR program tool for creating tests leaves the engineer free to concentrate on the most important thing – the operating features of the DUT and effective resolution of quality control issues with the low-current relays tested.
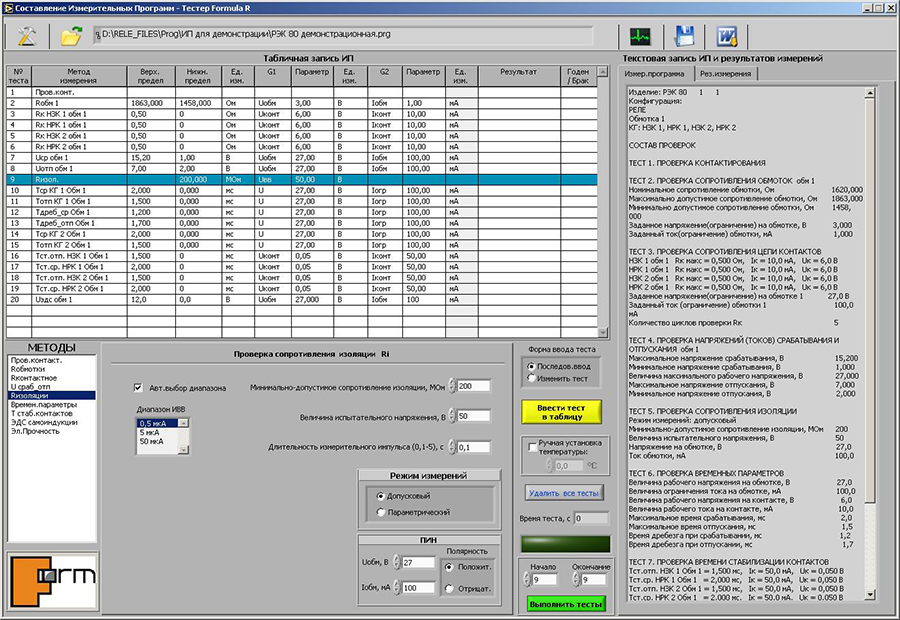
Fig. 3 Interface of the Test program Editor
Documentation of data and results
Testing process control includes automatic documentation of the data used to confirm the conformity or nonconformity of the DUT to the requirements of the technical specification or technical assignment. The test routines are generated with various levels of detail, from «Accept/ Reject» inspection to comprehensive reports on measurement modes and results for each relay and each parameter.
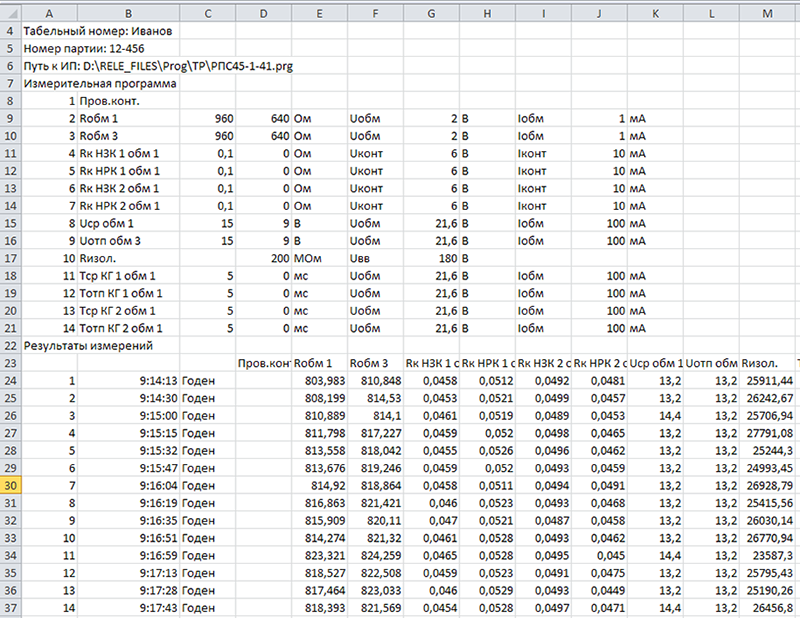
Fig. 4 Fragment of the test report
At the same time, statistical reports can be generated for any period by lots, types of relays and other criteria.
The test records are saved, easily converted to standard forms used by the Client, and serve as the documentary and metrological basis for managing deviations, and as a basis for quality complaint follow-up at the incoming inspection stage.
There is an on-line data translation into a specialized information quality control system and traceability Kamchatka®, as well as in other information systems of the enterprise, executed in accordance with CALS standards.
Means of analysis and display
The tools of graphical interpretation of the measurements data developed for the FORMULA® R Test system facilitate the analysis of deviations and accelerate the identification of sources of deviations.
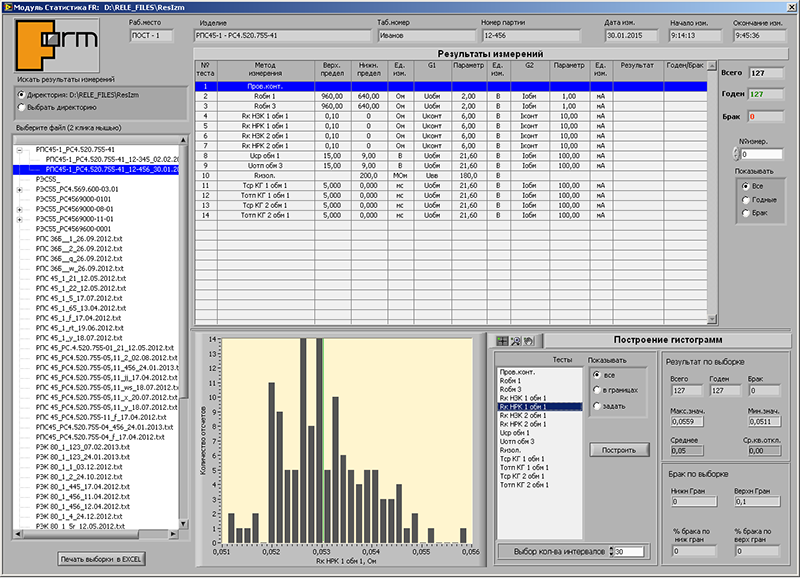
Fig. 5 Statistics mode interfaceہ
The «Statistics» software unit makes it possible to plot bar charts and graphs for visual interpretation of summary reports on measurements of various lots of devices over the required period Fig. 5 with the ability to analyze deviations in parameters and other indicators of items/lots.
The built-in high-resolution oscilloscope helps to make a visual assessment of the transients occurring at the contacts of the relay under test, as well as to investigate the behavior of the measured relay (Fig. 6, 7):
- detect hidden defects in the settings of the electromechanical system and the relay contact system
- estimate the stability of relay parameters
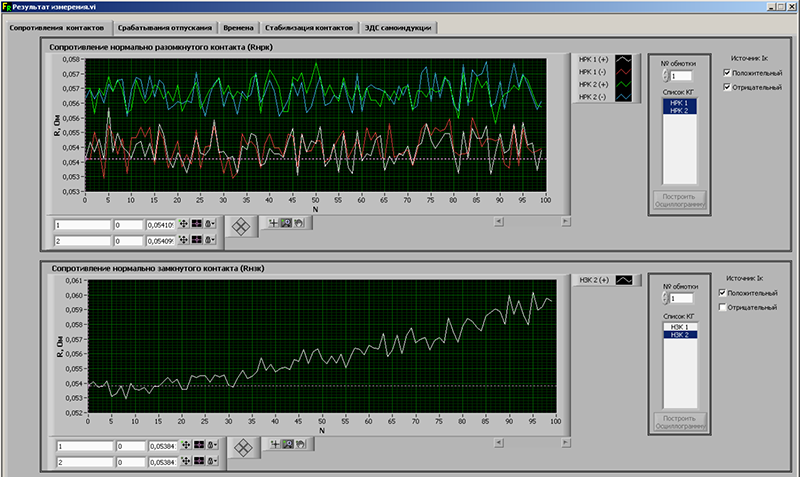
Fig. 6 Display run-in test cycles on the built-in oscilloscope ہ
Information content and visibility of oscillographic methods in combination with the software tools of the FORMULA® R Test system make them as accessible to the Consumer as standard measurement methods.
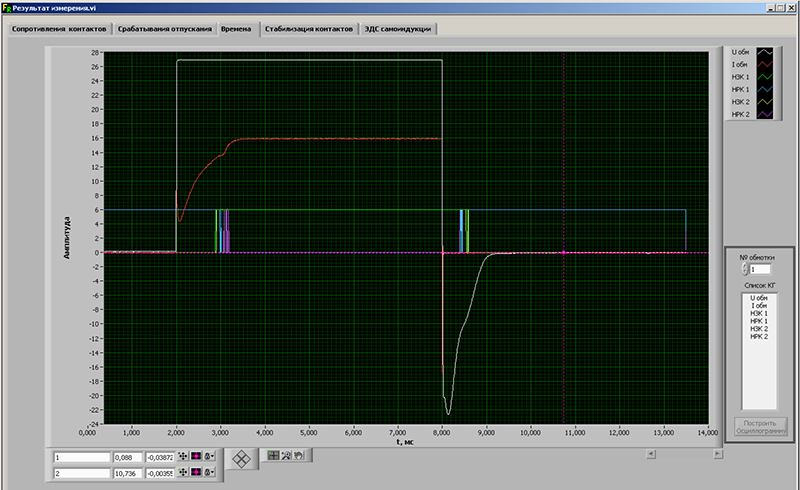
Fig. 7 Coil voltage/current waveforms during the operation of the relayہ
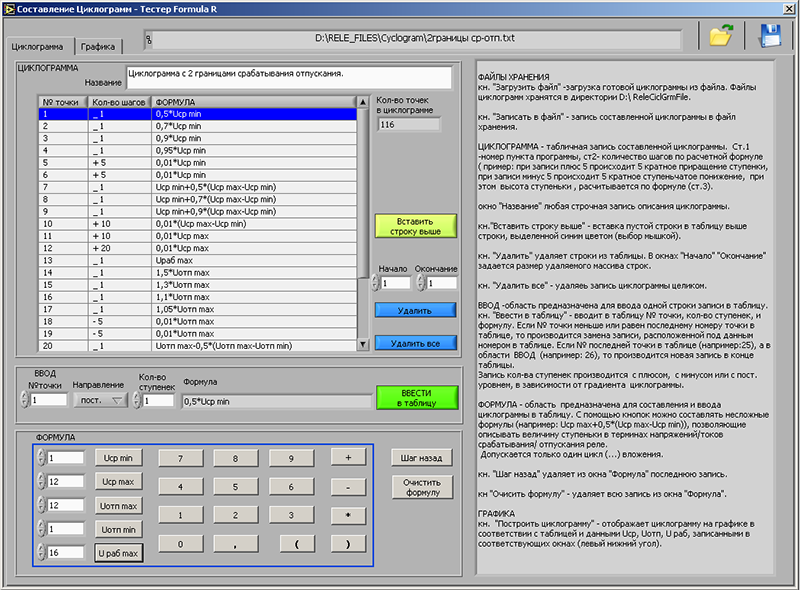
Cyclograms are the third most important tool of the test system for graphical interpretation of measurements.
For the first time the user is given the opportunity to independently define various forms of cyclograms with the help of the Cyclogram Editor (Fig. 7), which allows:
- monitor the results of deviations in the technology of manufacturing and relay settings with the specified accuracy
- conduct additional reseach of the behavior of the relay under various forms of the driving voltage on the coils
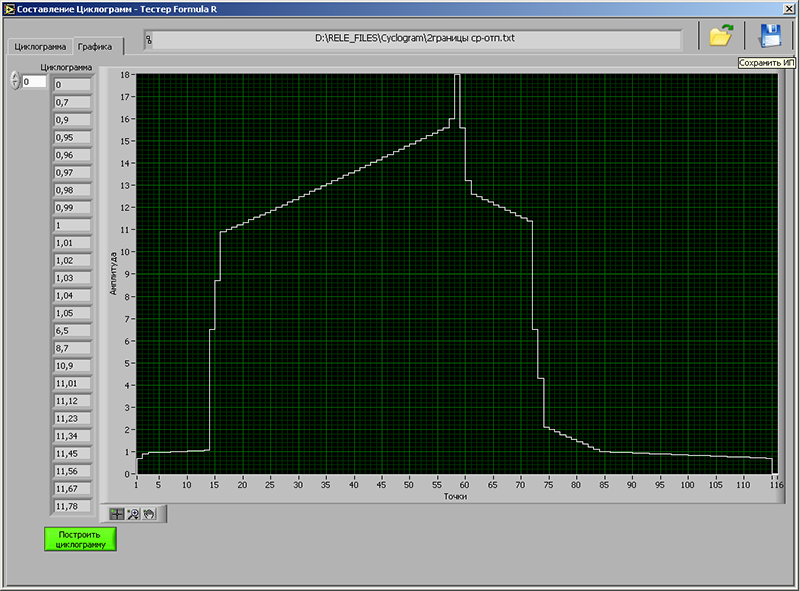
In addition, the user is provided with a built-in library of precision typical cyclograms (Fig. 8).
Automation of service and metrological support
The FR software service package covers all aspects of FORMULA® R Test System operation, including equipment serviceability, hardware diagnostics and verification of metrological conformity
It is possible to control diagnostics and calibration of the test system and automatically generate verification records
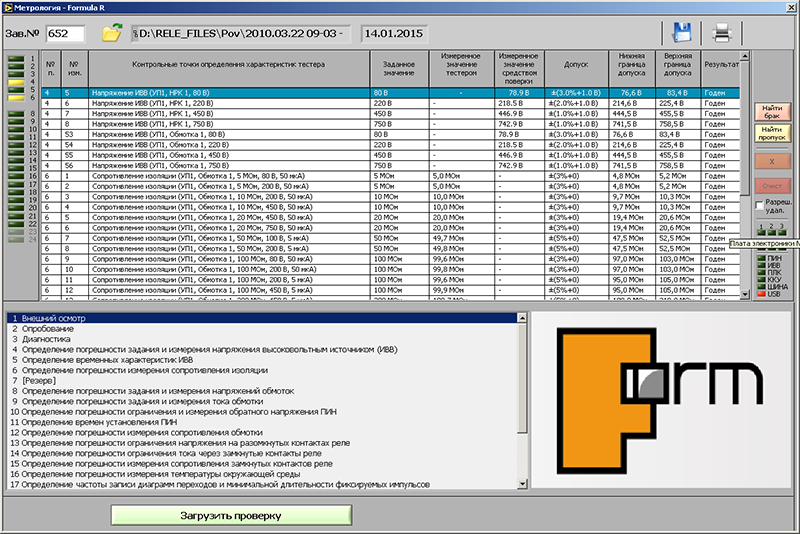
Fig. 10 Fragment of the automatically generated test report
Equipment maintenance time can be minimized and thus giving users complete confidence in the accuracy of measurement results.